More importantly, how would we know?
(Includes late breaking news from 4/30/2025 at end of article)
This article comes from a conversation here at the shop started by a very simple question… “How do you think the economy’s going?” That one question immediately brought up several more… how’s it going for who? Does it mean you personally, or the economy at large? Is YOUR view of the economy a valid gauge of how it’s doing overall? Most importantly, how would we decide the answers to any of these questions?
We won’t tell you how the shop conversation resolved, but we’ll try to answer the questions it raised. If we do a good job you’ll be able to answer the questions yourself… and explain why to others.
The difference between YOUR economy and THE economy
The outlook for everyone’s personal economy is plainly biased. Employment is the obvious factor that drives a personal economy… when you’re out of work the future looks bleak, but if you have a stable job with a good outlook then ‘the economy’ largely seems to happen to other people. If you have a job, your personal economy rises and falls both with things in your control (kids, home ownership, lifestyle, etc.) and out of your control (inflation, market crashes, wars, trade wars, etc.). Longer term, your economy is affected by your ability to put aside resources for the future through investments and savings.
Though large economies definitely shape personal economies, for this article we tried to evaluate ‘THE ECONOMY’ writ large.
What is our (or any) economy?
Each of us non-economists “knows what we mean” when we say “economy”, but the people who actually study it have to be precise. For our working definition of an economy we went to Investopedia, which said
“An economy is a complex system of interrelated production, consumption, and exchange activities, which ultimately determine how resources are allocated among participants. The production, consumption, and distribution of goods and services combine to fulfill the needs of those living and operating within the economy.”
So that’s our working definition. An economy doesn’t mean our personal economic situation, it means the overall production, distribution, and monetary activity of a defined system… the economy of a city, state, country, region (like the EU), or even the world, but NOT the individuals or businesses within it.
Economies change over time
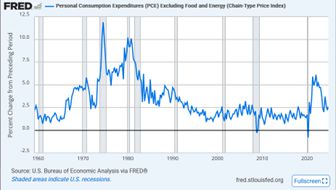
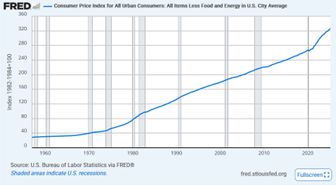
A critical point for the state of any economy is that it’s a moving target. Consider inflation… If the price of eggs is $5 a dozen, that doesn’t tell you much unless you know whether it was $3 or $7 yesterday. Any measurement of an economy only makes sense if you know the trend leading to it, so we showed graphs-over-time for all our data.
What measurements do economists apply to an economy?
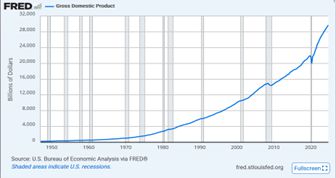
There’s no single measurement than tracks “how an economy is doing”. In fact, economists generally don’t pass judgement on whether an economy is ‘good’ or ‘bad’, ‘strong’ or ‘weak’. Instead, they put together a basket of measurements that tell what an economy is likely to do given its past performance, or compare it to trends in other economies. Gross Domestic Product (GDP) was the most important in every source and is probably closest to THE ONE measure of an economy, but there were at least 10 economic indicators that all sources shared. More indicators would be even more precise, but 10 separate ones give a pretty good picture. They are…
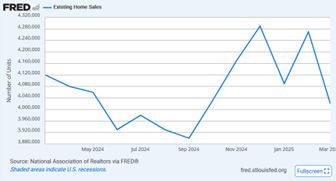
GDP Home Sales
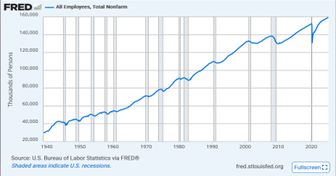
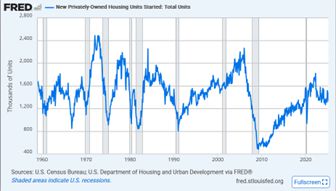
Employment Home Building
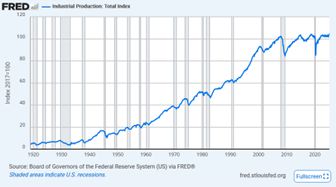
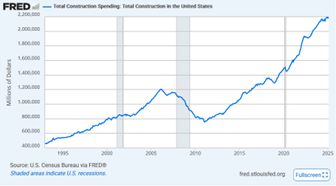
Industrial Production Construction Spending
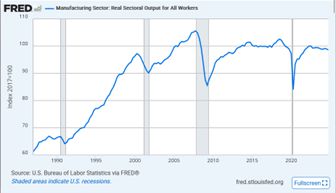
Consumer Spending Manufacturing Demand
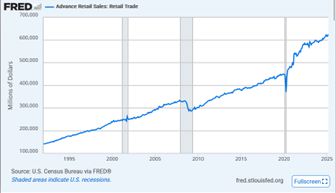
Inflation Retail Sales
Our Caveats– The graphs below are sourced from FRED, the Federal Reserve Economic Data from the St. Louis Fed. Several things to note:
- First, we chose them as (probably) one of the most rock-solid, no-BS sources around.
- Second, they were a single source for all the economic indicators we looked at, so any bias they have would at least be consistent through their information.
- Third, most of the data they’re using ends at Q4 of 2024 so while it’s the most recent data available it doesn’t cover the first part of 2025, coincidentally the first part of the second Trump term. We’ll have to wait to see how his numbers come out for comparison.
- Fourth, we chose them because they have a consistent graphic style. This isn’t just a nicety, it makes it clearer to compare between indicators but beware… some of the time scales differ, so the graphs may be comparing different time spans.
All that said, here’s ten indicators of how our economy’s doing…
How’s our economy doing? (In 10 simple graphs)
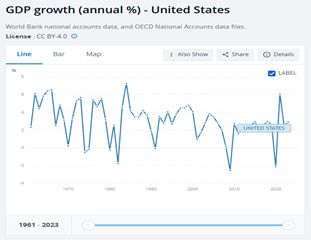
Our economy compared to rest of the world
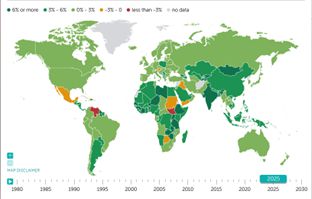
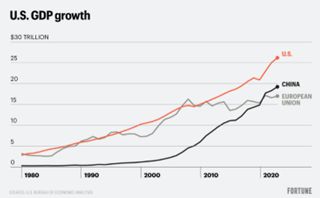
While our economy is growing (or shrinking) the rest of the world’s economies are growing (or shrinking) as well. Here’s a few graphs showing how well we’re doing against our global neighbors.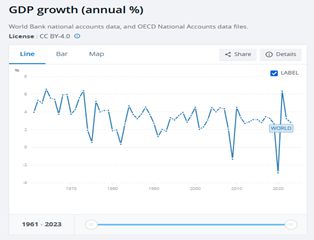
Spread of wealth within our economy
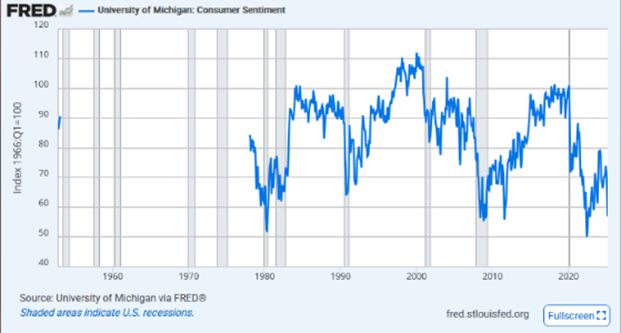
We said at the outset that “economy” means the larger economy, not our personal ones. But the larger economy is made up of all our personal ones, and our individual insights do play a role. Consider consumer spending, which keeps 2/3 of our economy afloat. That’s the result of our individual guesses about the economy so consumer sentiment, while not one of the indicators of a economic health, can be a good guide to what’s next. If you’re not confident you’ll participate in a growing economy you won’t be confident about the future, and that can become a self-fulfilling prophecy.
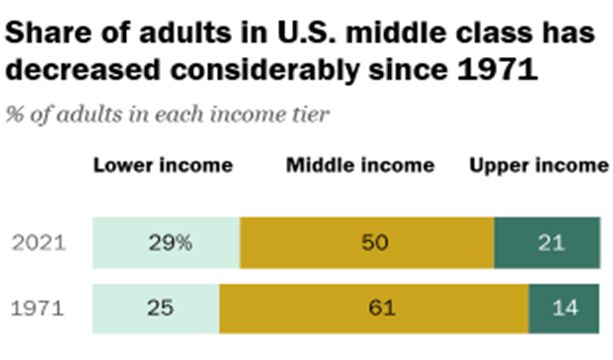
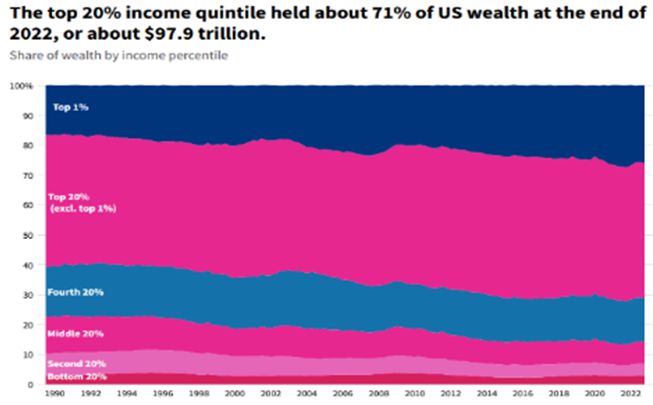
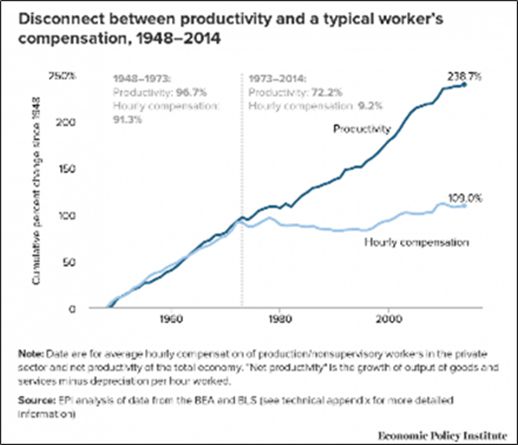
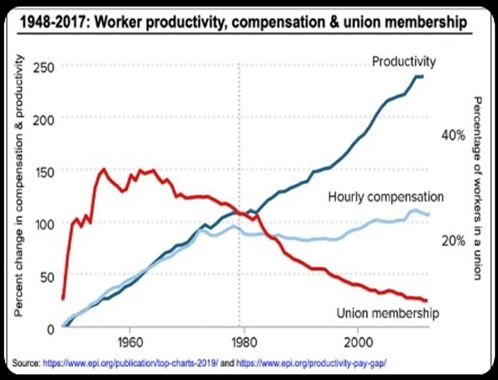
Perhaps most importantly, a rising tide of a strong national economy may not lift all boats and our personal economies may be unsustainable even if the country as a whole is doing great. Check that GDP number from our first GDP graph, smoothly and consistently rising from 1950 on. By that measure our economy has been growing, but the share of adults living in middle-class houses fell from 61% in 1971 to 50% in 2021, according to a new Pew Research Center analysis. Or check out the graph showing the spread of wealth from 1990-2022 showing the top 1% increased their share of the economy from 16.6% to 26%. How could that possibly happen? Well, check the next chart. It’s a famous one showing productivity vs wages. They used to move in lockstep until about 1972, when wages basically quit rising at all until today. Why? Check the one that has a union membership overlay. Now, correlation isn’t causation, but the lack of someone representing wage earners at a bargaining table could easily explain why wage earners have been poorly served in bargaining over the last 50 years. And that poor service has added up to an astonishing $50 TRILLION transferred from the bottom to the top since 1975.
No, really, how’s that economy working out for ya?
So how’s the economy? We may not be any closer to an answer than when we started. If you’re not an economist (maybe you’re something like an auto mechanic) then you have no choice but to listen to the experts but it’s hard to tell, even for them. Mark Zandi at Moody Analytics said “I’d give it an A+.”, but the Heritage Foundation grimly found we’d hit our worst-ever score on the ‘index of economic freedom’, whatever that is. Joseph Brusuelas at Real Economy said “One of the more underdiscussed economic developments following the shocks of the pandemic has been the outperformance of the United States economy compared with its G-7 peers.” On the other hand, Donald Trump says this is the “worst economy ever”. Who’s to say?
How’s the economy? It’s grown at a 2.9% annualized pace and seems on track to grow at or above 3% with full employment and inflation only slightly above Fed targets. Those other economic indicators also seemed to be trending, mostly if not universally, in a good direction. It’s not as easy as ‘good’ or ‘bad’, but it seems that Biden left Trump a strong, functional economy by every measure. One way or another, we’ll all see (and experience) what he does with it.
If nothing else, we hope we’ve shown that experts who gives a simple “thumbs up, thumbs down” are certainly oversimplifying if not outright lying. Understanding that there IS nuance in complex issues can help us all make better decisions even if we don’t understand the nuance itself. It’s better than jumping to simple, but wrong, conclusions.
LATE BREAKING NEWS!
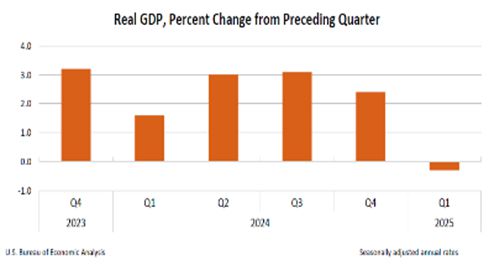
As we were putting the finishing touches on this article, we saw the most recent report from the Bureau of Economic Analysis at the US Department of Commerce. Apparently the Q1 2025 numbers are starting to come in. As we said, the health of an economy is determined by a basket of indicators but the GDP is the prime indicator to watch, and unfortunately, BEA’s numbers don’t look ideal. From the report…
“Real gross domestic product (GDP) decreased at an annual rate of 0.3 percent in the first quarter of 2025 (January, February, and March), according to the advance estimate released by the U.S. Bureau of Economic Analysis. In the fourth quarter of 2024, real GDP increased 2.4 percent. The decrease in real GDP in the first quarter primarily reflected an increase in imports, which are a subtraction in the calculation of GDP, and a decrease in government spending. These movements were partly offset by increases in investment, consumer spending, and exports.”
Read the whole thing here, but you’ll be hearing about it on the news all day.
Digging Deeper…
Economy: What It Is, Types of Economies, Economic Indicators, Will Kenton in Investopedia, Feb 2025
Trump wants you to believe that the US economy is doing terribly. It’s untrue, Steven Greenhouse in The Guardian, Oct 2024
The U.S. Consumer: Bearing the Weight, Mitchell Sinkler & Starr, 3rd quarter, 2022
Economy: What It Is, Types of Economies, Economic Indicators, Will Kenton on Investopedia, Feb 2025
Top 10 U.S. Economic Indicators, Poonkulali Thangavelu on Investopedia.com, Mar 2025
Gross Domestic Product (GDP) Formula and How to Use It, Jason Fernando on Investopedia, Jan 2025
New Privately-Owned Housing Units Started: Total Units, Federal Reserve Bank Economic Data
Employment rate, OECD
Graphics for Economic News Releases, US Bureau of Labor Statistics
Top 10 U.S. Economic Indicators, Thangavelu, Kelly, and Rosenston on Investopedia, Mar 2025
IMF says Trump’s tariffs will be a drag on global economic growth, Washinton Post, Apr 22
Real GDP growth, IMF.org
Data to decode: The economics of being a business owner, JP Morgan, May 2024
How the American middle class has changed in the past five decades, Kochhar and Sechopoulos at Pew Research, May 2024
How has wealth distribution in the US changed over time?, USAFacts, Nov 2023
News To Make You Furious- Hell’s Accountant, Tom Dwyer Automotive, Feb 2019
The Top 1% of Americans Have Taken $50 Trillion From the Bottom 90%-And That’s Made the U.S. Less Secure, Nick Hanauer in Time Magazine, Sep 2020
Strike A Blow For Independence! Tom Dwyer Automotive, Jun 2024
Tom’s Tidbits- Don’t “Eat the Rich”… Tax The Wealth! Tom Dwyer Automotive, Nov 2021
American outperformance in the global economy, Joseph Brusuelas at Real Economy Blog, Oct 2024
The $115 Trillion World Economy in One Chart, Pallavi Rao on Visual Capitalist, Dec 2024
Gross Domestic Product, 1st Quarter 2025, Bureau of Economic Analysis at the US Department of Commerce, Apr 2025
Why the U.S. Economy Isn’t as Weak as It Looks, Leonhardt and Peterson on Barron’s, Apr 2025